Question 1: Can I use GPS with the RS3 software?
Question 2: How can I increase the field of view of my SWIR spectrometer?
Question 3: How do I convert spectral data into ASCII text files?
Question 4: How do I position the fiber cable in the Pistol Grip?
Question 5: How does illumination or light source affect optimization?
Question 6: How does the fiber optic cable affect the response of my instrument?
Question 7: What are Absorbance Units?
Question 8: What are Digital numbers (DN)?
Question 9: What are Mylar, Kaolinite and Mercury Argon tests?
Question 10: What are the temperature effects on the ASD FieldSpec® instrument?
Question 11: What is a Chromophore?
Question 12: Why should I optimize my ASD spectrometer?
Question 1: Can I use GPS with the RS3 software?
Answer: The RS3 software enables the integration of spectral data with location data from a Global Positioning System (GPS). In order to function with RS3 , the GPS unit must be compliant with the National Marine Electronics Association (NMEA). 1 ASD has tested various brand names and models of GPS units, please contact ASD Technical Support for a current list.
To utilize the GPS device with the FieldSpec instrument, the GPS unit must first be set to NMEA output and then plugged into the serial port of the controlling computer. If the serial port is unavailable, a USB adapter to serial port will be necessary. After launching the RS3 software, the GPS function should be enabled. The GPS status is located at the bottom of the main window. It will display the latitude, longitude, and elevation of fixed GPS data.
Question 2: How can I increase the field of view of my SWIR spectrometer?
Answer: Fibers feeding light to the VNIR have a slightly BROADER field of view than the nominal 25 degrees in our specs, while the SWIR fibers have a slightly NARROWER field of view. This means that the VNIR spectrometer may be looking at targets that the SWIR spectrometers can’t see if they are only entering the edge of the field. Use of a lens fore optic, such as the 8-degree lens, is a good way to compensate for this problem.
Different fore optics will give different quality results, depending on the application:
- A lens is useful for collecting spectra from a distance.
- A bare fiber or an 18-degree tube for is useful for work with visible heterogeneity, like a gravel road or a plant canopy.
- Shiny round things, like apples, with potentially ugly edge effects, lend themselves well to use of the 8-degree fore optic.
- The one-degree fore optic is too bulky for up-close work.
Question 3:How do I convert spectral data into ASCII text files?
Answer: Use View Spec™ Pro to convert spectral data to ASCII text files. This can be done one file at a time or several files can be merged into a single text file, which is a useful feature when inputting data into other analysis programs.
Once you have specified the Input/Output directories, click on File and choose Open. Select the ASD format file(s) that need post-processing or you would like to plot and view.
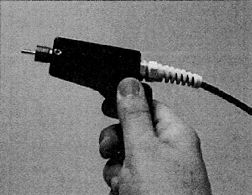
Question 4: How do I position the fiber cable in the Pistol Grip?
Answer: Insert the fiber optic tip directly into the back of the plastic strain relief. Firmly push cable through the front threaded end of the pistol grip until it locks into place, as shown above. Approximately 1 cm of the fiber optic tip should protrude out of the end of the pistol grip. Once the cable is securely locked in position,
mount any fore optic field-of-view limiters (FOVs).
Question 5: How does illumination or light source affect optimization?
Answer: The less intense the illumination, the more diffuse (homogeneous) it will be. An average spot size of reasonable homogeneity is about 10 cm at a 50 cm lamp distance. Two lamps improve this geometry significantly, especially for large targets. If lighting conditions are so poor that you are continually re-optimizing, try optimizing with a brighter source:• For outdoor optimization, tilt the Spectralon panel directly towards the sun during optimization.
• For enclosed illumination of targets requiring contact measurements, we recommend ASD’s High Intensity Reflectance Probe or Source Probe.
• Under low light conditions, consider using a reference panel < 99-100% white and then post-process out the difference between the white and gray reference in ViewSpec™ Pro.
Question 6:How does the fiber optic cable affect the response of my instrument?
Answer: The fiberoptic cable is made up of fifty-seven randomly distributed glass fibers. Nineteen of these fibers are 100-micron and are distributed to the VNIR region. The remaining fibers are 200-micron and are evenly divided between the two SWIR regions. All fifty-seven fibers are housed in a plastic sheath. A standard cable has a diameter of 0.19 inches while an all-weather cable has a diameter of 0.27 inches.
The fibers are protected by a metal spiral inside the black cable casing and are free to float inside the metal spiral. If there are kinks in your cable, the fibers are not necessarily damaged. If, however, your cable has been crunched so severely that you are able to see the protective metal spiral, the chances are high that the fibers have been damaged too. Each broken fiber results in a 5% loss of response..Question 7: What are Absorbance Units?
Answer: When referring to Absorbance measurements the units are usually indicated by AU for absorbance units (eg. Absorbance = 6 AU)
| Absorbans | = log(1/Transmittanceλ) | Example: | Transmittance | = 10-6 |
| = -log(Transmittanceλ) | Absorbance | = –log (10-6) | ||
| -Absorbance | = log (10-6) | |||
| 10-Absorbance | = 10-6 | |||
| Absorbance | = 6 AU |
Question 8: What are Digital numbers (DN)?
Answer: (DN): Values between 0 and 65,535.Question 9: What are Mylar, Kaolinite and Mercury Argon tests?
Answer: Data sent with each ASD spectrometer may include the following calibration graphs: NEdL (Noise Equivalent Radiance), Mylar, Mercury Argon, and Kaolinite.
The NEdL graph is a representation of signal to noise ratio of the instrument. This plot displays three regions that correspond to each spectrometer. If you were to look at the raw data from which this NEdL plot was created, you would see that the response for each detector is optimum in the mid-range. The NEdL plot is an inverse illustration of the raw data - giving you the lowest noise level within these three ranges. ASD’s goal is to adjust each of the splice, step, and size values for the corresponding spectrometers toinsure the "best" detector response
The purpose of the Mylar (1000-2500nm) and the Mercury Argon (350-1000nm) graphs is to confirm and illustrate specific wavelengths. It is very important that each spectrograph registers specific wavelengths accurately, in order to guarantee good spectral data. If any of these specific wavelength targets are not within +/- 1 nm of the wavelength standards, we then know each spectrometer must be re-tuned. However, the graphs of these samples are not meant to check for uniformity between each spectrograph. Both of these samples are very specular - which is good because it is those reflective properties/absorption features that allow us to confirm nm accuracy - however they are not optimal for determining uniformity due to two key reasons:
• Variable surfaces (ie specular samples) result in different fields of view across the random fibers for each spectrometer and can, in turn, give rise to steps
• The field of view for the Vnir region is slightly larger than the Swir regions - by about 1 degree - therefore, any slight change in viewing geometry and/or a spectra from a specular sample can also give rise to steps
The purpose of the Kaolinite (1000-2500nm) is to not only to confirm wavelength accuracy and sensitivity, but also to give us a look at uniformity. Kaolinite is a uniform, non-specular sample and should represent a smooth, clean spectrum across the full spectral range. Sensitivity and accuracy are measured by the doublet seen at 1404 nm. If you take a look at Kaolinite graph, you will see this doublet along with another absorption feature at approximately 966.8 nm. Do not confuse this absorption feature with the splice between Vnir and Swir1 - this is not the same wavelength. In fact, the splices for this unit are at approximately 1000nm (Vnir and Swir 1) and at 1800nm (Swir 1 and Swir 2) - and should be very smooth and clean in the Kaolinite graph.
Because most natural samples are non-specular, the step that sometimes appears with specular data, such as the Mylar reflectance, is negligible. To guarantee smooth, clean, and accurate data, collect a large number of spectra and average them together in post-processing using ViewSpec™ Pro. The "look" of your sample spectra can also be manipulated by altering the viewing geometry.
Question 10: What are the temperature effects on the ASD FieldSpec® instrument?
Answer: All of the ASD FieldSpec full-range systems (FRs) have thermo-electrically cooled SWIR detectors (to -25° C), significantly reducing noise in those areas. "Cooled" FieldSpec FRs have a thermo-electrically cooled VNIR array as well to ensure stability in response. By stabilizing the detector temperature, the software fix is unnecessary. The VNIR arrays are cooled to about 20° C and the system operates continuously from about 0 to 40° C.
If the FieldSpec® instrument is exposed to direct sunlight, depending on the intensity of the sunlight, the effective operating period may be shortened. When the system fails due to extreme temperature, it will fail gradually but obviously — the data won’t make proper sense. Shut down and let the instrument cool in the shade before operating againQuestion 11: What is a Chromophore?
Answer: Some materials absorb energy by electron transition and are called ’chromophores.’ Chromophores typically involve covalently bonded unsaturated groups such as phenylır.
Question 12: Why should I optimize my ASD spectrometer?
Answer: Optimizing your ASD spectrometer results in:
- Automatic setting of Gains and Offsets for the Swir detectors
- Automatic setting of Integration Time value for Vnir detector
- Automatic Dark Current collect
Optimization values depend on the response to light in a particular spectral region. A well-optimized instrument will display between 20 and 35 thousand DN (approx.), if the source is within the Gain and Integration time abilities of the system.
A Spectralon blank should be used when optimizing and for taking a white reference measurement. An Optimization is required before any data is acquired.
The instrument must be re-optimized after any change in temperature - internal or environmental - or lighting conditions . If lighting conditions don’t change at all, the Gain won’t change significantly from the value after optimization; but Offset, even if it changes by 10 (say from 2150 to 2160), will have a significant effect if Gain is relatively high, like around 25. The SWIR 2 dark current increases with temperature and dramatically reduces the dynamic range of the spectrometer. Note that conditions can change rapidly or slowly, it all depends on clouds, wind (affecting temperature), instrument warm up time, etc.